Elasticsearch Part 4: Analytical Queries
Welcome back to our deep dive into Elasticsearch! So far, we’ve mastered the art of finding the right documents. We’ve become experts in queries, filters, and the mighty bool query. But what happens after you’ve retrieved your results? How do you make sense of the bigger picture?
This is where the true analytical power of Elasticsearch shines: Aggregations.
If queries answer the question “Which documents match my search?”, aggregations answer the far more strategic questions:
- “What are the sales trends for the last quarter?”
- “Who are my top 10 customers by revenue?”
- “What is the average response time of my application, broken down by hour?”
- “What are the most common error messages in my logs?”
In this post, we’ll move from search to discovery. We’ll unlock the techniques to transform raw data into actionable insights.
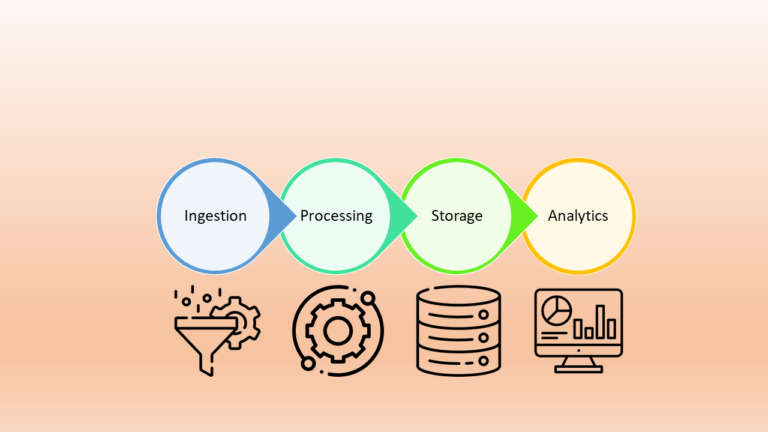
What Are Aggregations? Think “Group By” on Steroids
At its core, an aggregation is a framework for building summaries and analytics over your search results. It’s similar to the GROUP BY clause in SQL, but far more powerful and flexible, especially with unstructured or semi-structured data.
Aggregations work by crunching the set of documents returned by your query (or the entire index) and producing a structured set of information, or buckets. Aggregations operate in the context of a query. You can aggregate over all documents, or just the subset that matches your search criteria. This combination is incredibly powerful.
The Two Flavors of Aggregations: Buckets and Metrics
Understanding this distinction is the first step to aggregation mastery.
- Bucket Aggregations: These group documents into “buckets,” like putting items into different folders. Imagine you have a pile of invoices. A
date_histogramwould create a bucket for each day. Atermsaggregation would create a bucket for each unique product category.- Goal: To segment your data.
- Metrics Aggregations: These calculate statistics within a bucket (or over all documents). For the “Product Category A” bucket, a metrics aggregation can tell you the
avgsale price, themaxsale price, thesumof all sales, and thecountof documents.- Goal: To summarize the data in each segment.
The real magic happens when you nest them: you use a bucket aggregation to create segments, and then use metric aggregations to analyze each segment.
Building Your Analytics Toolkit: Essential Aggregation Types
Let’s look at the most common and useful aggregations you’ll use daily.
1. The Terms Aggregation: Your “Top N” List Generator
This is arguably the most popular bucket aggregation. It creates a bucket for each unique value in a field. e.g. Find the top 5 most common product categories in our inventory.
GET /products/_search
{
  "size": 0, // We don't need the actual search hits
  "aggs": {
    "top_categories": {
      "terms": {
        "field": "category.keyword",
        "size": 5 // Return the top 5 buckets
      }
    }
  }
}
The Result: You’ll get a list of the 5 most frequent categories and their document counts.
2. The Date Histogram: Your Time-Series Workhorse
This is essential for any time-based data. It creates buckets based on a time interval (e.g., per month, per day, per hour).
The following quer returns a time-series breakdown of your monthly revenue. This is the foundation for all your dashboards and trend analysis.
GET /orders/_search
{
  "size": 0,
  "aggs": {
    "sales_over_time": {
      "date_histogram": {
        "field": "order_date",
        "calendar_interval": "month" // Creates one bucket per month
      },
      "aggs": { // This is a NESTED aggregation, calculating a metric for each time bucket
        "monthly_revenue": {
          "sum": { // This is a metric aggregation
            "field": "total_amount"
          }
        }
      }
    }
  }
}
3. The Range Aggregation: For Custom Groupings
When you need to create your own segments, the range aggregation is your friend.
Use Case: Segment our products into budget, mid-range, and premium price tiers.
GET /products/_search
{
  "size": 0,
  "aggs": {
    "price_ranges": {
      "range": {
        "field": "price",
        "ranges": [
          { "to": 50.0 },
          { "from": 50.0, "to": 200.0 },
          { "from": 200.0 }
        ]
      }
    }
  }
}
4. Essential Metrics Aggregations: The Math You Need
These are often nested inside buckets to provide the summary.
avg: The average value of a numeric field.sum: The total sum of a numeric field.min/max: The smallest/largest value.stats: A handy multi-purpose metric that returnscount,min,max,avg, andsumin one go.
Putting It All Together: A Real-World Analytics Query
Let’s build a query that a business analyst might run. We want to find the top 3 product categories by total revenue, but only for orders placed in the last 30 days.
This combines everything we’ve learned: a query context, a terms bucket, and a nested metric.
GET /orders/_search
{
  "query": {
    "range": {
      "order_date": {
        "gte": "now-30d/d" // Filter: orders from the last 30 days
      }
    }
  },
  "size": 0,
  "aggs": {
    "top_categories_by_revenue": {
      "terms": {
        "field": "product.category.keyword",
        "size": 3
      },
      "aggs": {
        "category_revenue": { // This metric is calculated FOR EACH category bucket
          "sum": {
            "field": "line_items.price"
          }
        }
      }
    }
  }
}
The output will clearly show the three most profitable categories over the last month and exactly how much revenue they generated.
Tips for Aggregation
- Use
.keywordfor Terms: For text fields, you almost always want to aggregate on the.keywordsub-field to get exact value buckets. - Mind the
sizeParameter: Thetermsaggregation only returns the top N terms by default. Increase thesizeif you need to see more. size: 0for Performance: If you only care about aggregations and not the search hits, set"size": 0to save network bandwidth and processing time.- Combine with Filter Clause: Remember the
filtercontext from theboolquery? You can use apost_filterto run aggregations over your full result set but only return a filtered set of hits to the user. This is perfect for building faceted search.
Conclusion: From Data to Decisions
Aggregations transform Elasticsearch from a powerful search engine into a full-fledged analytics platform. They allow you to move beyond individual records and understand the patterns, trends, and summaries hidden within your data.
By mastering bucket and metric aggregations, and learning how to nest them, you can build complex analytical queries to power dashboards, reports, and data-driven features in your applications.
Ready to catch up or review?