My Favorite Python Libraries for Fast Data Exploration
Let me be honest: when I sit down with a fresh dataset, I’m not looking for ceremony. I’m looking for clarity. That first hour matters more than most people admit. I want to get a feel for the terrain—what’s messy, what’s surprising, what’s worth digging into. If I can’t answer “what’s going on here?” in minutes, not hours, I risk losing momentum.
I’ve learned this the hard way. Early in my career, I’d spend half a day setting up clusters, schemas, dashboards—only to realize the dataset wasn’t even worth that investment. That stings. These days, I’d rather sketch before I paint, taste before I cook, warm up before I run. Data exploration is no different.
Over the years, I’ve experimented with dozens of tools. But when the clock is ticking—or when curiosity is too strong to wait—I find myself reaching for the same small stack, again and again. Think of this as a minimalist’s toolkit. Not a “best of everything,” but the essentials I trust when speed and clarity matter most.
What “fast” means in practice
When I say fast exploration, I’m not just talking about benchmarks. I mean:
- Zero-to-query in minutes. No cluster setup, no yak-shaving—just open the laptop and start.
- Room to breathe. Handle 1–10 GB comfortably without swapping or waiting forever.
- Tight loops. Inspect → transform → visualize → validate, without breaking flow.
- Plays well with others. Arrow at the center, no fighting formats.
Fast tools keep me in the zone. They let me follow a hunch before it slips away.
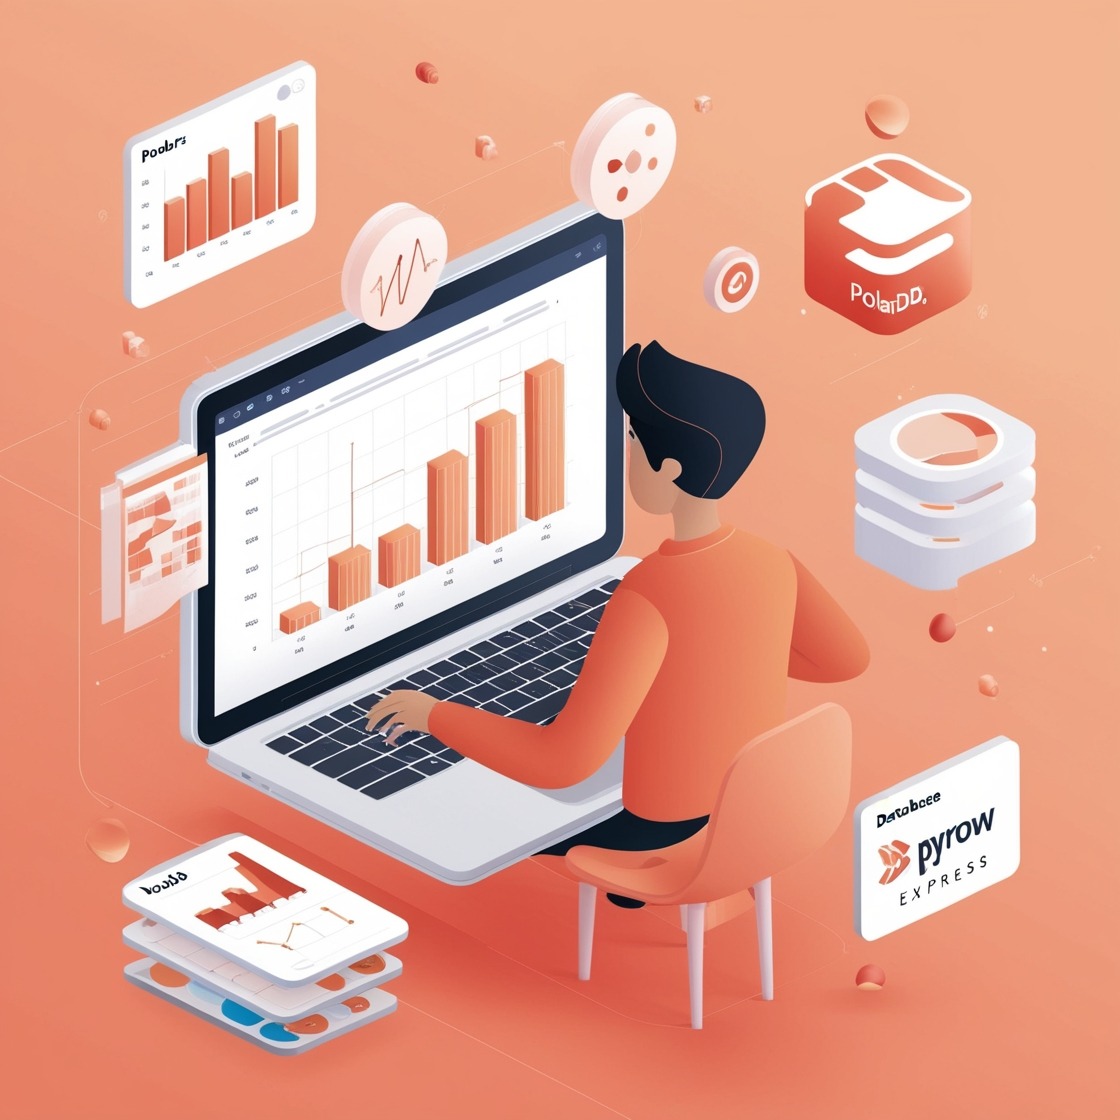
The core stack (4 libraries I actually use)
1. Polars — my default dataframe engine
Polars is the engine I lean on most days. Built on Rust and Arrow, it’s blazingly fast. But more than speed, it gives me confidence. I can group, join, or window over millions of rows without that sinking feeling: “will I be waiting five minutes for this?”
I reach for it 80% of the time: loading Parquet, filtering, joins, quick aggregates. And when things get heavier, the lazy API optimizes the query plan for me. It’s like having an assistant who quietly rearranges your messy code into something smarter.
import polars as pl

# Load Parquet file
df = pl.read_parquet("events.parquet")

# Quick filtering, grouping, and aggregation
top_pages = (
    df.filter(pl.col("country") == "DE")
      .group_by("page")
      .agg([
          pl.len().alias("visits"),
          pl.col("dwell_time").mean().alias("avg_time")
      ])
      .sort("visits", descending=True)
      .head(5)
)

print(top_pages)

# Lazy API for optimization
lazy_df = df.lazy().filter(pl.col("country") == "US").group_by("device").count()
print(lazy_df.collect())
2. DuckDB — SQL on anything
DuckDB feels like SQLite’s analytical cousin. I love it because sometimes SQL is just faster than code—especially when I need to double-check a result or sanity-check an aggregation.
It queries Parquet/CSV directly, joins across files, and integrates smoothly with Polars or Pandas. My favorite part? No ceremony. I can point it at a folder of files and start asking questions.
import duckdb

# Run SQL directly on Parquet files
result = duckdb.sql("""
    SELECT category, COUNT(*) AS n, AVG(price) AS avg_price
    FROM 'data/products/*.parquet'
    WHERE price > 0
    GROUP BY category
    ORDER BY n DESC
""")

print(result.df())  # Convert to Pandas if needed

# You can also query in-memory Polars/Pandas DataFrames
import polars as pl
df = pl.DataFrame({"a": [1, 2, 3], "b": ["x", "y", "z"]})
duckdb.query("SELECT a, b FROM df WHERE a > 1").show()
3. PyArrow — the glue
Arrow doesn’t get much glory, but it deserves it. It’s the quiet infrastructure that makes modern data tools cooperate. Without Arrow, I’d be stuck copying, converting, and reloading—losing minutes that add up to hours.
I treat Arrow tables as my “native” format. Load once, filter, slice, pass between libraries, and only convert when necessary. It keeps memory low and frustration lower.
import pyarrow.parquet as pq
import pyarrow.compute as pc

# Load big parquet file into Arrow Table
table = pq.read_table("big.parquet")

# Filter with Arrow (zero-copy, very fast)
filtered = table.filter(pc.equal(table["country"], "FI"))

# Save subset
pq.write_table(filtered, "big_fi.parquet", compression="zstd")

# Convert to Polars directly
import polars as pl
pl_df = pl.from_arrow(filtered)
print(pl_df.head())
4. Plotly Express — quick visuals for sanity checks
Exploration without visuals is like reading with one eye closed—you’ll miss something. Plotly Express is my go-to here. With a single line of code, I get an interactive chart I can pan, zoom, or hover.
These aren’t dashboards for execs; they’re notes to myself. A histogram to see outliers. A boxplot to check distribution. A line chart to spot weird dips. It’s fast, rough, and incredibly useful.
import plotly.express as px
import polars as pl

# Sample data
df = pl.DataFrame({
    "country": ["DE", "DE", "FR", "FR", "US", "US"],
    "amount": [100, 120, 90, 110, 150, 130]
}).to_pandas()  # Plotly expects Pandas

# Histogram
fig1 = px.histogram(df, x="amount", nbins=5, title="Transaction Amounts")
fig1.show()

# Boxplot
fig2 = px.box(df, x="country", y="amount", title="Spending by Country")
fig2.show()
My 10-minute loop
Here’s what this looks like in practice:
- Load with Polars → peek at shape, dtypes, head.
- Summarize with
df.describe()or a DuckDB query. - Plot 2–3 charts with Plotly Express.
- Save a cleaned subset with Arrow/Parquet for next steps.
Ten minutes in, I’ve already sketched the landscape. I know where to zoom in, what’s noisy, and whether the dataset is worth a full pipeline.an 10 minutes, I can see the big picture, spot anomalies, and decide where to dig deeper.
Small habits that compound
- Prefer Parquet over CSV: saves space, time, and nerves.
- Sample smart:
duckdb.sql("SELECT * FROM 'big.parquet' USING SAMPLE 5%"). - Push filters down: let Polars/DuckDB do the heavy lifting before Pandas.
- Watch types early: define categories/dates → faster ops later.
These aren’t glamorous tips, but over months and years, they add up to hours saved—and fewer headaches.
Final thoughts
Exploration is part curiosity, part ergonomics. The right tools don’t just save time—they protect your flow. They let you stay curious without drowning in setup, waiting, or conversion errors.
If you only pick two tools from this list, start with Polars and DuckDB. Add Plotly Express for visuals, and let Arrow quietly do the heavy lifting.
This minimal stack has carried me through messy CSVs, massive Parquet lakes, and last-minute analysis requests. It’s not perfect, but it keeps me moving—and sometimes, that’s all you need.
Stay curious, and keep it fast.